The resource for today is called Create-a-Graph.

What is Create-a-Graph?
Create-a-Graph is an interactive, online tool that helps teach students how to create their own graphs and then interpret the results. Create-a-Graph was created by the National Center for Education Statistics to allow students to create a graph by a few clicks of a button, letting them change the shapes, background, number of grid lines, and so much more. Students are exposed to the following graphs: line, bar, scatter, pie, and area. Further, students can use the "Dare to Compare" feature and test out their skills of graphing in comparison to those around the world.
Is it free?
Create-a-Graph is free for all users. There is no paid program option, which is great for the classroom!
What will Create-a-Graph bring to your classroom?
This product can prove to be beneficial in all different grades throughout the education system. From using it in the Kindergarten classroom to graph the daily lunch count to using it in 12th grade classrooms to create a pie chart of where people are intending to go after they graduate to a college student identifying the amount of money people make in the community using a plotted graph. This tool brings an easier way to create graphs using technology rather than by paper and pencil.
How do I use Create-a-Graph?
Below, I will show you the steps of using Create-a-Graph.
-Daily lunch count
-Daily question to graph answers
-Turn word problems into graphs
-Bar graph census of your classroom
-Graph the number of M&Ms in a pack
-Measure lima bean plants and graph daily
-Use to display classroom data in any subject
-Pie chart of what students eat for the holidays
-Measure students and add data to create a scatter plot
-Pie chart as a class of how many siblings each student has
-Look at pie graphs to identify the different fractions being represented
-Survey work to create graphs from responses (favorite color, animal, etc.)
-Use for data analysis in math when working on questions involving tables
-Lucky charm graphing (graph the number of marshmallows in a box of lucky charms)
-Graph the amount of people in the community, city, state, nation, world and compare answers
Honestly, the possibilities are ENDLESS.
How would YOU use VoiceThread in your classroom? Answer in the comments on this post!
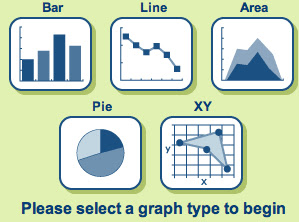
Step 1: Choose the graph you would like to create.

Step 3: Enter your data. This would be your graph title, x-axis label, y-axis label, source (optional), data set, and group name. Then, enter the column titles and the values for each. Make sure to do the min-value and max-value for the graph.


Step 4: Enter the labels for your data. You can also change the label and font colors and sizes.

Step 5: Preview your graph.

Step 6: Click the print / save page. This is where you can print, save, download, or e-mail your graph to someone. Or, you can start over, erase this graph, or copy to a new graph!

Step 2: This is where you can change your information for the design. You can alter the direction, shape, and style.
Step 3: Enter your data. This would be your graph title, x-axis label, y-axis label, source (optional), data set, and group name. Then, enter the column titles and the values for each. Make sure to do the min-value and max-value for the graph.
Step 4: Enter the labels for your data. You can also change the label and font colors and sizes.
Step 5: Preview your graph.
Step 6: Click the print / save page. This is where you can print, save, download, or e-mail your graph to someone. Or, you can start over, erase this graph, or copy to a new graph!
------------------------------------------------------------------------
How can I use Create-a-Graph in my classroom?
Below is a list of ways that this tool can be utilized in the classroom:
-Daily lunch count
-Daily question to graph answers
-Turn word problems into graphs
-Bar graph census of your classroom
-Graph the number of M&Ms in a pack
-Measure lima bean plants and graph daily
-Use to display classroom data in any subject
-Pie chart of what students eat for the holidays
-Measure students and add data to create a scatter plot
-Pie chart as a class of how many siblings each student has
-Look at pie graphs to identify the different fractions being represented
-Survey work to create graphs from responses (favorite color, animal, etc.)
-Use for data analysis in math when working on questions involving tables
-Lucky charm graphing (graph the number of marshmallows in a box of lucky charms)
-Graph the amount of people in the community, city, state, nation, world and compare answers
Honestly, the possibilities are ENDLESS.
How would YOU use VoiceThread in your classroom? Answer in the comments on this post!
No comments:
Post a Comment